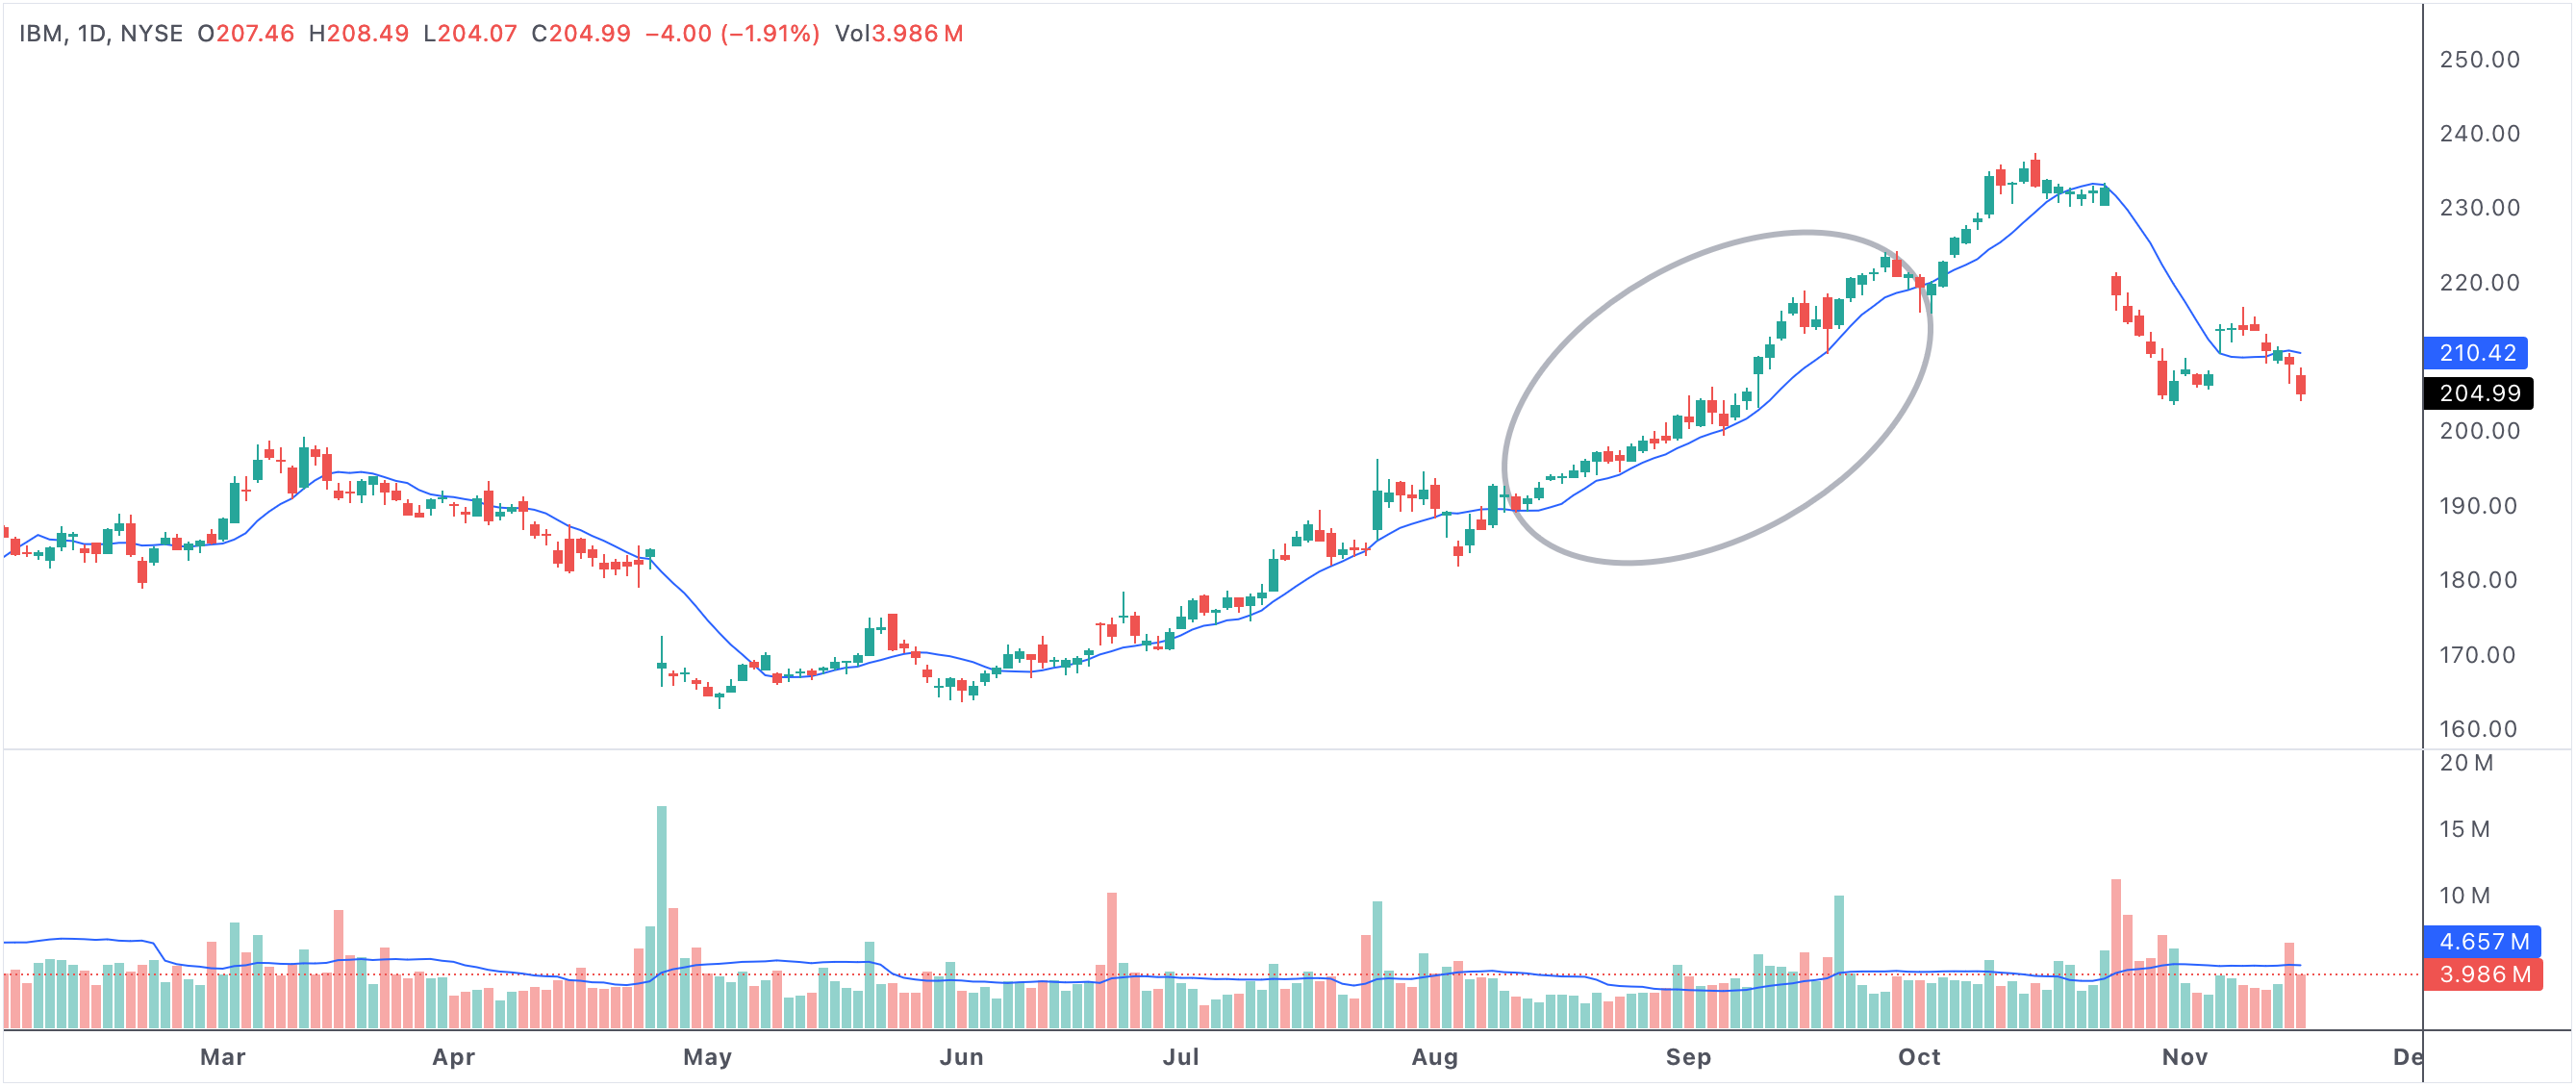
Stocks above 10 SMA for longest consecutive days indicate strong momentum
Observing stocks above the 10-day simple moving average (SMA) for the longest consecutive days is a powerful technical strategy to identify market momentum and possible turning points. The 10 SMA is a short-term moving average that reacts quickly to price changes, making it a favorite among active traders who want to capture the early stages of bullish trends or spot signals for a trend reversal.

daysgt10sma
A real chart example of a stock closing above its 10-day SMA for many days in a row.
Stocks above 10 SMA for longest consecutive days
Why the 10-day SMA Matters in Trading
The 10-day SMA is a key short-term trend indicator. When a stock closes above its 10 SMA for several days in a row, it often means buyers are firmly in control and short-term momentum is strong. This can attract technical traders and momentum investors looking to ride the trend for as long as it lasts. However, an extended run above the 10 SMA may also serve as a caution signal, suggesting the stock could be overbought and vulnerable to a pullback or brief consolidation.
Bullish and Bearish Implications of Consecutive Closes Above 10 SMA
In most cases, the more days a stock closes above its 10-day SMA, the greater the confirmation of a bullish short-term trend. This is especially true if the price action is supported by rising volume or positive news catalysts. Trend-following traders often use this setup as a signal to enter or add to positions, aiming to capitalize on continued upward price action.
However, it’s important to recognize the potential downside. If a stock has remained above its 10 SMA for an unusually long streak—often 10 or more days—it may have entered an overbought condition. This does not automatically mean the uptrend is over, but it suggests the probability of a pullback or a cooling-off period increases. Seasoned traders may tighten stops, take partial profits, or look for signs of waning momentum such as lower highs or bearish candlestick patterns.
How to Interpret and Trade the Longest 10 SMA Streaks
- Strong uptrends: Prolonged closes above the 10 SMA confirm robust buying pressure and trend strength, especially in leading stocks or hot sectors.
- Potential reversal: If the stock finally breaks below the 10 SMA after a long streak, it can trigger a wave of selling as short-term traders exit and momentum stalls.
- Profit-taking opportunities: Experienced traders often use extended 10 SMA streaks as exit signals, especially when combined with other overbought indicators such as RSI or price exhaustion gaps.
- Context is key: If the overall market is bullish, these streaks can persist far longer than expected. In contrast, during choppy or bearish markets, even short streaks above the 10 SMA can offer tradeable moves.
Real Market Examples and Strategy Insights
Many high-performing growth stocks have exhibited runs of 10, 15, or even 20+ consecutive closes above their 10-day SMA during powerful uptrends. These streaks often coincide with breakouts from consolidation patterns, earnings surprises, or news events that capture broad market attention.
For example, during a strong bull market phase, you might see technology or biotech stocks lead the charge, frequently showing the longest 10 SMA streaks. Conversely, even in bear markets, short, sharp rallies above the 10 SMA can offer quick trading opportunities for nimble traders.
It’s crucial to combine the 10 SMA strategy with other technical tools, such as support/resistance levels, candlestick analysis, and volume trends. Doing so can help confirm trade signals and manage risk more effectively.
Risks, Rewards, and Risk Management
While streaks above the 10 SMA are often bullish, no single indicator is foolproof. Sudden reversals, false breakouts, or unexpected news can lead to quick changes in market sentiment. That’s why disciplined risk management—like using trailing stops or partial profit-taking—is essential when trading based on moving average signals.
In summary, monitoring stocks for the longest consecutive days above the 10-day SMA is a valuable way to spot leadership, momentum, and shifts in market psychology. By combining this insight with sound technical analysis and prudent risk management, traders can improve their chances of participating in some of the market’s strongest short-term moves.