Stocks above 50 SMA for longest consecutive days - bullish signals and risk
When stocks remain above their 50-day simple moving average (SMA) for the longest consecutive days, it is often interpreted as a strong bullish signal. The 50-day SMA is one of the most widely followed technical indicators in trading and investing. A stock trading above this level for a prolonged period reflects consistent momentum and widespread investor confidence. Market participants may view this as confirmation of a healthy, ongoing uptrend.

daysgt50sma
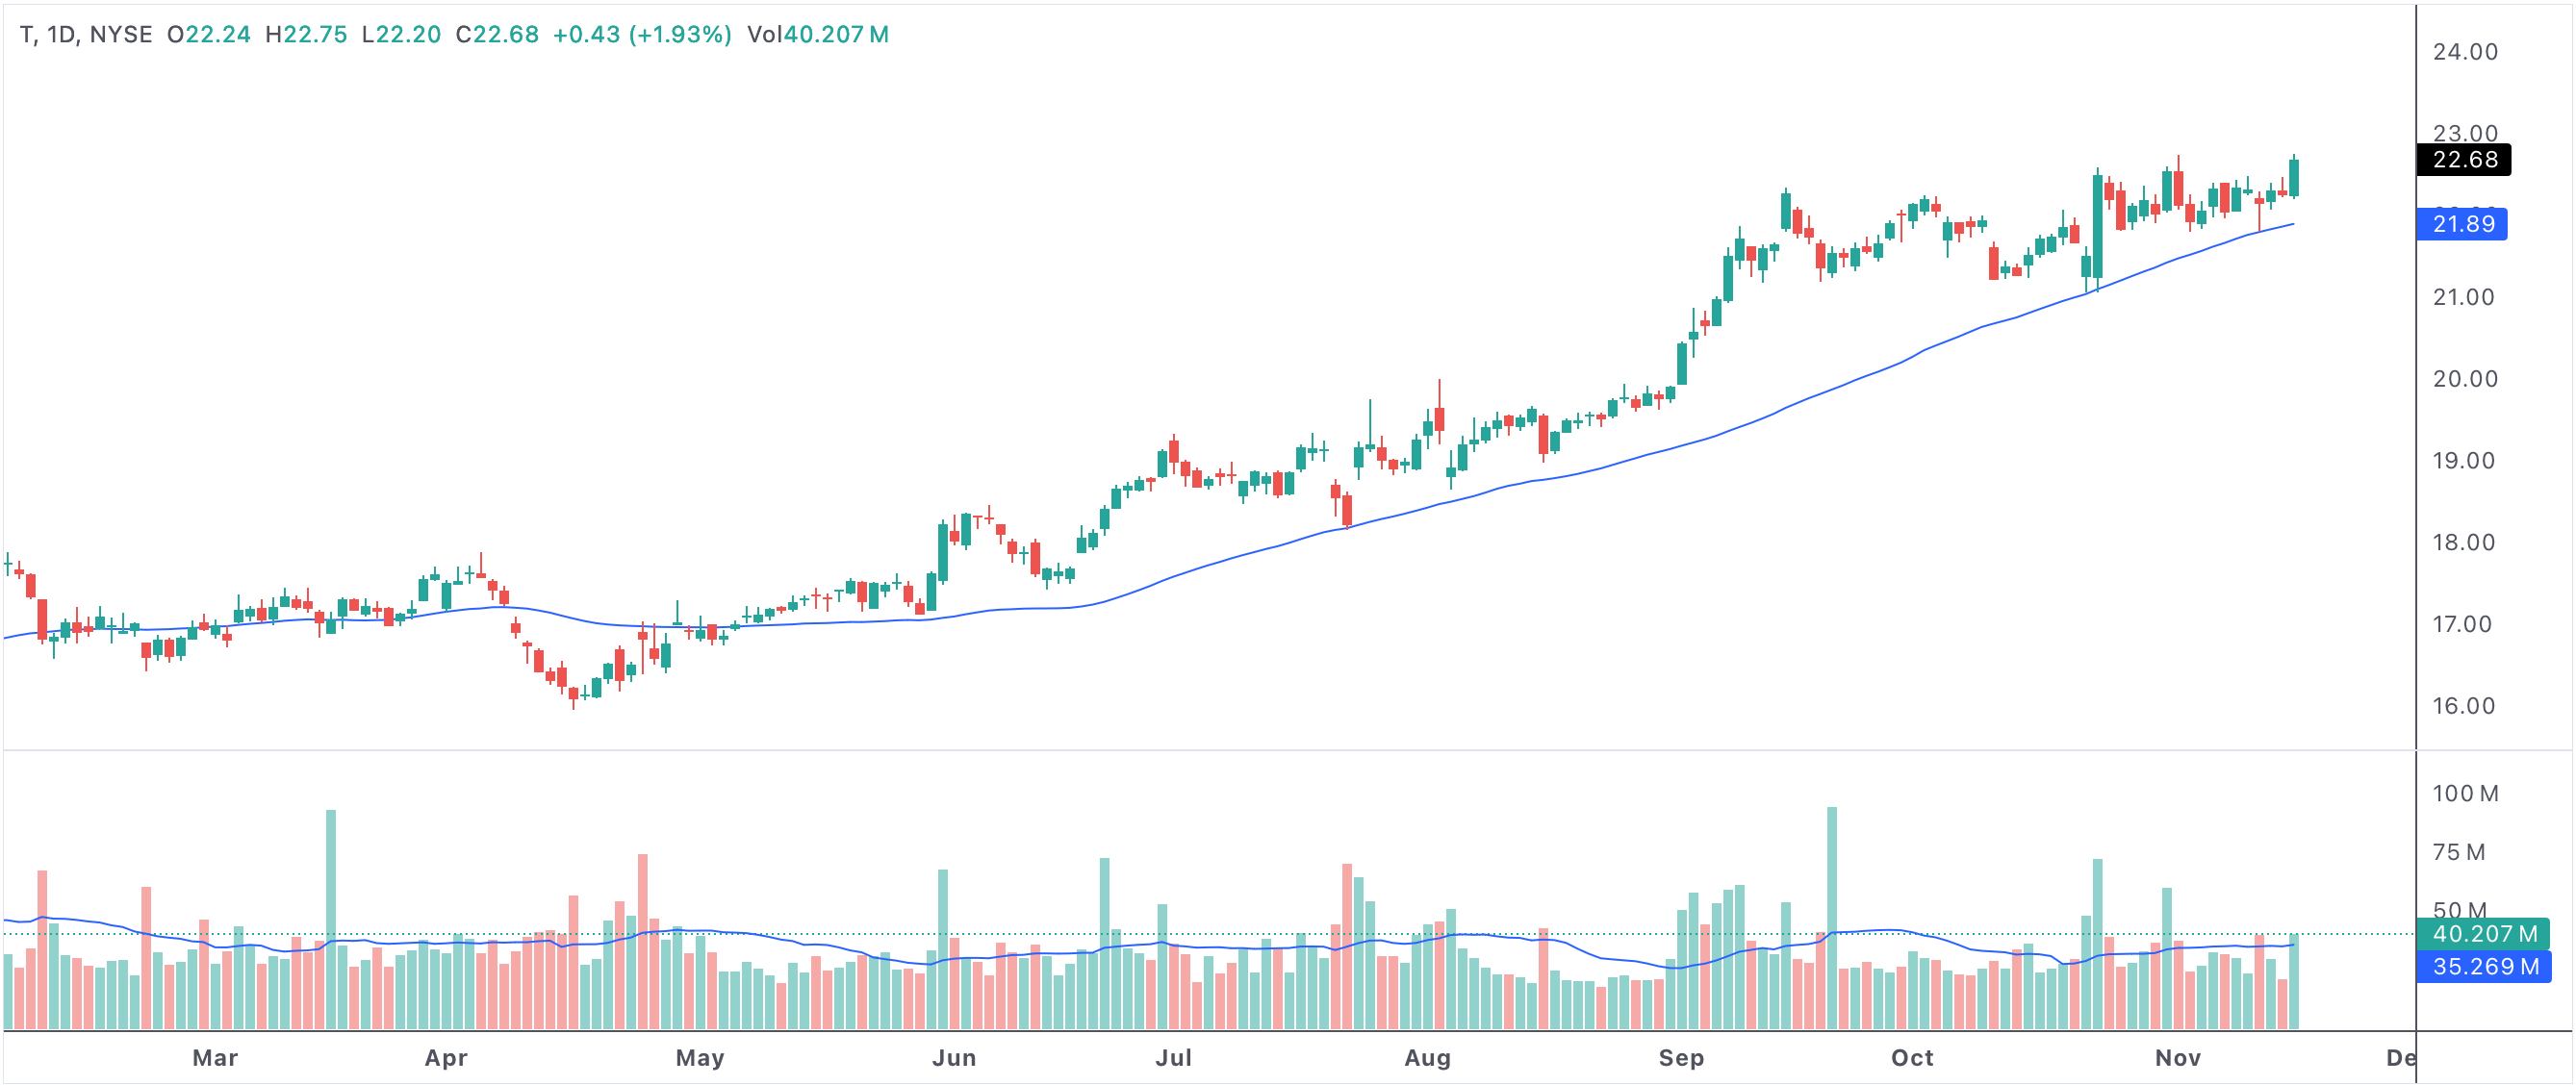
An example of a stock above 50 SMA for the longest consecutive days
Stocks above 50 SMA for longest consecutive days
Why the 50-Day SMA Matters
The 50-day SMA is commonly used as a mid-term trend indicator. It smooths out daily price fluctuations and helps traders see the overall market direction. When a stock stays above its 50 SMA for an extended stretch, it signals that buying interest is not only present but persistent. This attracts momentum traders, institutional investors, and trend followers who often use this level to confirm strength and plan entries.
Stocks with the longest runs above their 50-day SMA can often be leaders in a bullish market phase. The trend may be supported by positive earnings, strong sector rotation, or favorable macroeconomic conditions. News headlines, social media chatter, and analyst upgrades often reinforce bullish sentiment during these streaks.
Bullish Implications of Prolonged Uptrends
Prolonged trading above the 50 SMA usually leads to increased trading volume and attracts even more participants looking to ride the momentum. As the trend continues, short sellers may get squeezed out, further fueling upward movement. Many institutional investors track this indicator as a filter for portfolio additions, since sustained price strength above the 50 SMA can reflect underlying demand and company quality.
Stocks that consistently hold above this moving average for weeks or even months may be perceived as stable and reliable in their uptrend. The longer the streak, the greater the perception of market support and positive sentiment.
The Downside: Overbought and Correction Risks
However, remaining above the 50 SMA for too long without a meaningful pullback can push stocks into overbought territory. Overbought conditions occur when prices advance too quickly and valuations outpace fundamentals. This often leads to concerns about sustainability. Seasoned investors become wary when an uptrend is uninterrupted for an unusual length of time, especially if it isn’t accompanied by earnings growth or robust financial metrics.
The risk is that prolonged rallies attract speculative buyers late in the move, making the trend vulnerable to sharp corrections if sentiment suddenly shifts. Technical indicators such as the Relative Strength Index (RSI) may confirm overbought readings, while negative news or broader market volatility can spark profit-taking and reversals.
- Extended periods above the 50-day SMA show powerful momentum and bullish conviction.
- Institutional and retail investors may use these streaks to confirm upward trends.
- However, overbought conditions can increase as stocks trend higher without correction.
- Watch for signals such as declining volume, bearish divergences, or negative news flow.
- Corrections are often sharper when rallies have run too far above the 50 SMA for too long.
How Traders and Investors Respond
Savvy traders use trailing stops, monitor technical divergence, and keep an eye on volume trends to protect gains during long runs above the 50 SMA. Some investors may scale out of positions or take partial profits as overbought signals build. Others prefer to wait for a healthy pullback to the 50-day SMA as a potential reentry point, since the moving average often acts as dynamic support in a healthy uptrend.
For long-term investors, these periods are a good opportunity to reassess portfolio holdings. If fundamentals remain strong and the price action is supported by real growth, staying the course may make sense. However, when price becomes decoupled from value, caution is wise.
Conclusion: Opportunity Meets Caution
The longest consecutive days above the 50-day SMA highlight robust bullish momentum and widespread market confidence. However, as rallies persist, the risks of becoming overbought and vulnerable to correction grow. Combining technical signals with fundamental analysis and prudent risk management can help traders and investors capture upside while staying alert to changing market conditions.